EN ISO 10211 & 13788 calculation verification
Every calculation module in Psiclops is verified against published reference values from EN ISO 10211, EN ISO 13788, ISO 6946, ISO 13370, and BR 443. The results below run live on the production worker using the same code that computes your calculations, refreshed at least every 5 minutes — or use the button below to run them again right now.
Reference standards
→
EN ISO 10211:2017
2D FEM thermal bridge solver — Annex C test reference cases 1 and 2
→
EN ISO 13788:2012
Glaser condensation — Annex C worked examples C2, C5, C6
→
ISO 6946:2017
U-value simple summation — first principles verification
→
ISO 13370:2017
Ground floor heat transfer — slab-on-ground equations
→
BR 443
UK conventions for U-value calculations
→
BR 497
UK conventions for linear thermal transmittance (ψ) and temperature factors
Every verification case is solved from scratch — usually about 30 seconds.
All verification checks passed
119 passed · 0 failed · 119 total checks across 14 verification groups
Computed 2026-09-25 17:06 UTC · refreshes automatically at least every 5 minutes
✓
Check
Reference
Expected
Got
PASS
Grid point (1,7) temperature
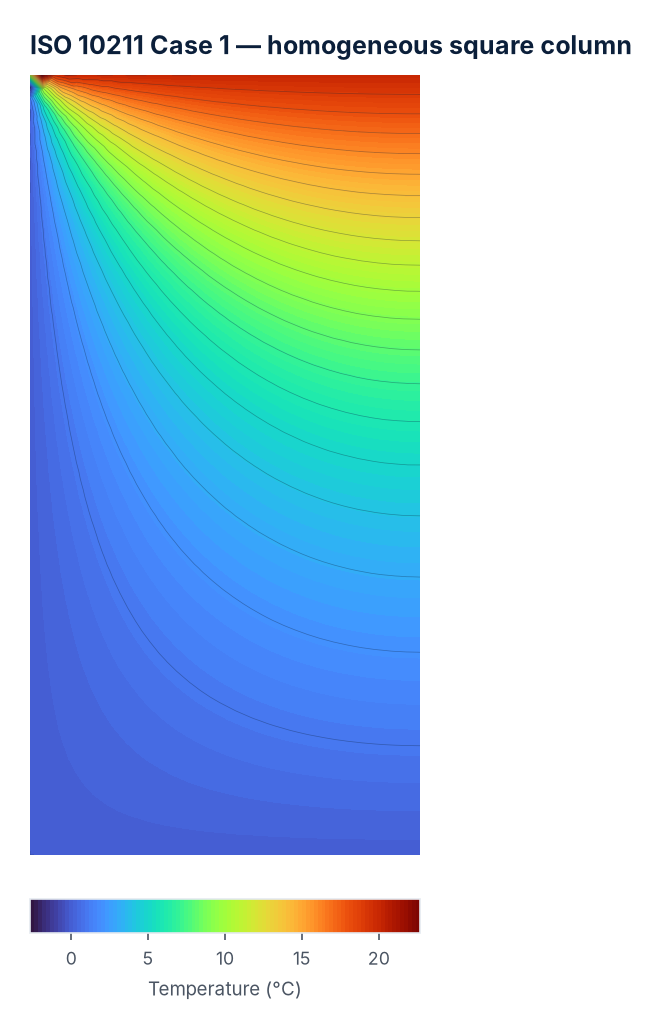
Homogeneous square column, half-modelled by symmetry.
EN ISO 10211:2017 Annex C, Test reference case 1
9.66 °C
9.65 °C
PASS
Grid point (2,7) temperature
Homogeneous square column, half-modelled by symmetry.
EN ISO 10211:2017 Annex C, Test reference case 1
13.38 °C
13.38 °C
PASS
Grid point (3,7) temperature
Homogeneous square column, half-modelled by symmetry.
EN ISO 10211:2017 Annex C, Test reference case 1
14.73 °C
14.73 °C
PASS
Grid point (4,7) temperature
Homogeneous square column, half-modelled by symmetry.
EN ISO 10211:2017 Annex C, Test reference case 1
15.09 °C
15.08 °C
PASS
Grid point (1,6) temperature
Homogeneous square column, half-modelled by symmetry.
EN ISO 10211:2017 Annex C, Test reference case 1
5.25 °C
5.25 °C
PASS
Grid point (2,6) temperature
Homogeneous square column, half-modelled by symmetry.
EN ISO 10211:2017 Annex C, Test reference case 1
8.64 °C
8.64 °C
PASS
Grid point (3,6) temperature
Homogeneous square column, half-modelled by symmetry.
EN ISO 10211:2017 Annex C, Test reference case 1
10.32 °C
10.32 °C
PASS
Grid point (4,6) temperature
Homogeneous square column, half-modelled by symmetry.
EN ISO 10211:2017 Annex C, Test reference case 1
10.81 °C
10.81 °C
PASS
Grid point (1,5) temperature
Homogeneous square column, half-modelled by symmetry.
EN ISO 10211:2017 Annex C, Test reference case 1
3.19 °C
3.19 °C
PASS
Grid point (2,5) temperature
Homogeneous square column, half-modelled by symmetry.
EN ISO 10211:2017 Annex C, Test reference case 1
5.61 °C
5.61 °C
PASS
Grid point (3,5) temperature
Homogeneous square column, half-modelled by symmetry.
EN ISO 10211:2017 Annex C, Test reference case 1
7.01 °C
7.01 °C
PASS
Grid point (4,5) temperature
Homogeneous square column, half-modelled by symmetry.
EN ISO 10211:2017 Annex C, Test reference case 1
7.47 °C
7.46 °C
PASS
Grid point (1,4) temperature
Homogeneous square column, half-modelled by symmetry.
EN ISO 10211:2017 Annex C, Test reference case 1
2.01 °C
2.01 °C
PASS
Grid point (2,4) temperature
Homogeneous square column, half-modelled by symmetry.
EN ISO 10211:2017 Annex C, Test reference case 1
3.64 °C
3.64 °C
PASS
Grid point (3,4) temperature
Homogeneous square column, half-modelled by symmetry.
EN ISO 10211:2017 Annex C, Test reference case 1
4.66 °C
4.66 °C
PASS
Grid point (4,4) temperature
Homogeneous square column, half-modelled by symmetry.
EN ISO 10211:2017 Annex C, Test reference case 1
5.0 °C
5.0 °C
PASS
Grid point (1,3) temperature
Homogeneous square column, half-modelled by symmetry.
EN ISO 10211:2017 Annex C, Test reference case 1
1.26 °C
1.26 °C
PASS
Grid point (2,3) temperature
Homogeneous square column, half-modelled by symmetry.
EN ISO 10211:2017 Annex C, Test reference case 1
2.31 °C
2.31 °C
PASS
Grid point (3,3) temperature
Homogeneous square column, half-modelled by symmetry.
EN ISO 10211:2017 Annex C, Test reference case 1
2.99 °C
2.99 °C
PASS
Grid point (4,3) temperature
Homogeneous square column, half-modelled by symmetry.
EN ISO 10211:2017 Annex C, Test reference case 1
3.22 °C
3.22 °C
PASS
Grid point (1,2) temperature
Homogeneous square column, half-modelled by symmetry.
EN ISO 10211:2017 Annex C, Test reference case 1
0.74 °C
0.74 °C
PASS
Grid point (2,2) temperature
Homogeneous square column, half-modelled by symmetry.
EN ISO 10211:2017 Annex C, Test reference case 1
1.36 °C
1.36 °C
PASS
Grid point (3,2) temperature
Homogeneous square column, half-modelled by symmetry.
EN ISO 10211:2017 Annex C, Test reference case 1
1.77 °C
1.77 °C
PASS
Grid point (4,2) temperature
Homogeneous square column, half-modelled by symmetry.
EN ISO 10211:2017 Annex C, Test reference case 1
1.91 °C
1.91 °C
PASS
Grid point (1,1) temperature
Homogeneous square column, half-modelled by symmetry.
EN ISO 10211:2017 Annex C, Test reference case 1
0.34 °C
0.34 °C
PASS
Grid point (2,1) temperature
Homogeneous square column, half-modelled by symmetry.
EN ISO 10211:2017 Annex C, Test reference case 1
0.63 °C
0.63 °C
PASS
Grid point (3,1) temperature
Homogeneous square column, half-modelled by symmetry.
EN ISO 10211:2017 Annex C, Test reference case 1
0.82 °C
0.82 °C
PASS
Grid point (4,1) temperature
Homogeneous square column, half-modelled by symmetry.
EN ISO 10211:2017 Annex C, Test reference case 1
0.89 °C
0.89 °C
Computed temperature field (colour) with isotherm contours (black lines)
Check
Reference
Expected
Got
PASS
Point A temperature
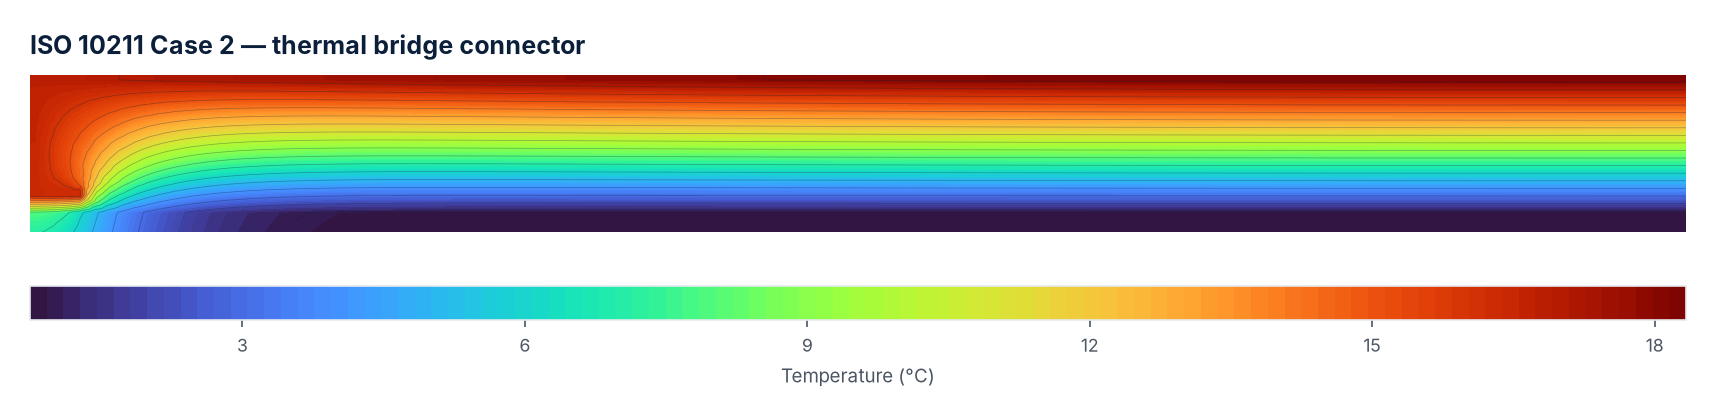
Multi-material thermal bridge connector — aluminium bracket through concrete/insulation.
EN ISO 10211:2017 Annex C, Test reference case 2
7.1 °C
7.1 °C
PASS
Point B temperature
Multi-material thermal bridge connector — aluminium bracket through concrete/insulation.
EN ISO 10211:2017 Annex C, Test reference case 2
0.8 °C
0.8 °C
PASS
Point C temperature
Multi-material thermal bridge connector — aluminium bracket through concrete/insulation.
EN ISO 10211:2017 Annex C, Test reference case 2
7.9 °C
7.9 °C
PASS
Point D temperature
Multi-material thermal bridge connector — aluminium bracket through concrete/insulation.
EN ISO 10211:2017 Annex C, Test reference case 2
6.3 °C
6.3 °C
PASS
Point E temperature
Multi-material thermal bridge connector — aluminium bracket through concrete/insulation.
EN ISO 10211:2017 Annex C, Test reference case 2
0.8 °C
0.8 °C
PASS
Point F temperature
Multi-material thermal bridge connector — aluminium bracket through concrete/insulation.
EN ISO 10211:2017 Annex C, Test reference case 2
16.4 °C
16.4 °C
PASS
Point G temperature
Multi-material thermal bridge connector — aluminium bracket through concrete/insulation.
EN ISO 10211:2017 Annex C, Test reference case 2
16.3 °C
16.3 °C
PASS
Point H temperature
Multi-material thermal bridge connector — aluminium bracket through concrete/insulation.
EN ISO 10211:2017 Annex C, Test reference case 2
16.8 °C
16.8 °C
PASS
Point I temperature
Multi-material thermal bridge connector — aluminium bracket through concrete/insulation.
EN ISO 10211:2017 Annex C, Test reference case 2
18.3 °C
18.3 °C
PASS
Total heat flow rate
Heat loss through the exterior boundary, per metre depth.
EN ISO 10211:2017 Annex C, Test reference case 2
9.5 W/m
9.5 W/m
Computed temperature field (colour) with isotherm contours (black lines)
Check
Reference
Expected
Got
PASS
Effective Sd (2D FEM) vs 1D Glaser sum(µ×thickness)
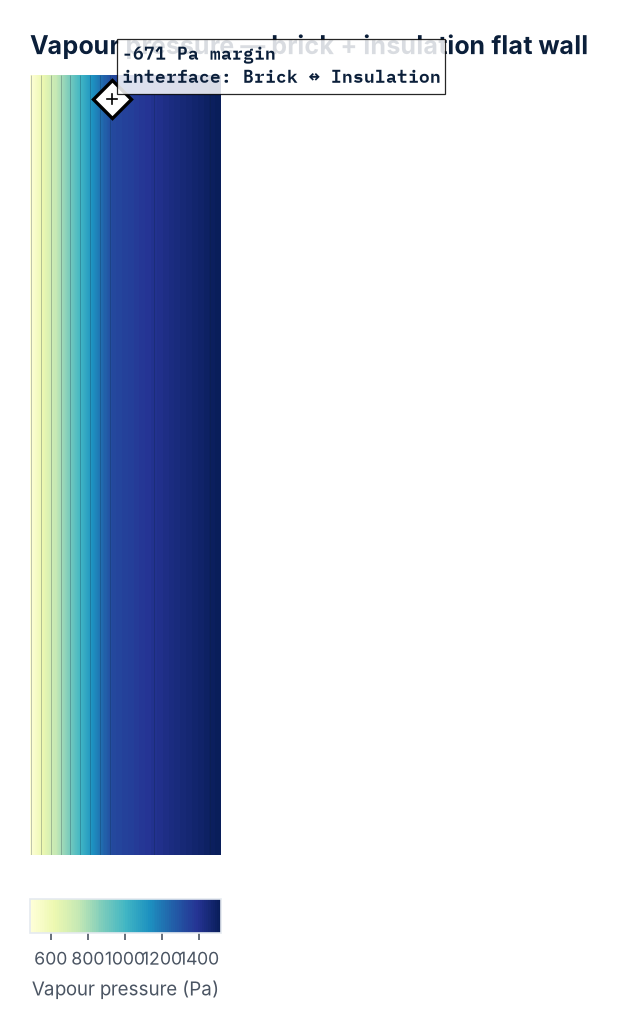
Flat parallel-plate wall — no thermal bridging, so the 2D field-based method and the classic 1D layer-walk describe identical physics.
Cross-check against this app's own EN ISO 13788-validated glaser.py
1.036 m
1.036 m
PASS
Vapour pressure at insulation|brick interface
The 2D field's own worst (least-margin) point falls at this same interface.
Cross-check against this app's own EN ISO 13788-validated glaser.py
1324.0 Pa
1324.0 Pa
PASS
Saturation pressure at insulation|brick interface
Confirms the Glaser-standard thermal reference solve (Rsi=0.13/Rse=0.04) — not fRsi's own borrowed Rsi=0.25 — is being used correctly.
Cross-check against this app's own EN ISO 13788-validated glaser.py
652.8 Pa
652.8 Pa
PASS
Interstitial condensation risk verdict
This specific construction (no vapour control layer) genuinely fails Glaser — a real risk case, not a manufactured pass, chosen because it exercises the risk=True path, not just the easier always-safe case.
Cross-check against this app's own EN ISO 13788-validated glaser.py
yes
yes
Computed temperature field (colour) with isotherm contours (black lines)
Check
Reference
Expected
Got
PASS
Saturation pressure at 0°C
0°C is the freezing point — the saturation pressure here is the baseline constant in the Magnus formula.
Magnus formula constant
610.5 Pa
610.5 Pa
PASS
Saturation pressure at 1°C
December external condition in the C2 roof example. The standard publishes 657 Pa at this temperature.
EN ISO 13788:2012 Annex C Figure 24 — December external surface temperature
657.0 Pa
656.4 Pa
PASS
Saturation pressure at 20°C
Standard internal design temperature. The standard publishes 2338 Pa — this value appears throughout Annex C.
EN ISO 13788:2012 Annex C Figure 24 — internal surface temperature
2338.0 Pa
2337.0 Pa
PASS
December external vapour pressure (θe=1°C, φe=88%)
Actual vapour pressure = relative humidity × saturation pressure. The standard publishes 578 Pa for this condition.
EN ISO 13788:2012 Annex C Figure 24 — December boundary condition
578.0 Pa
577.6 Pa
PASS
December internal vapour pressure, high occupancy (θi=20°C, φi=51%)
The standard publishes 1192 Pa for this condition. High occupancy means more moisture production inside the building.
EN ISO 13788:2012 Annex C Figure 24 — December high occupancy boundary condition
1192.0 Pa
1191.8 Pa
PASS
Saturation pressure increases monotonically with temperature
Verified across -10°C to 25°C in 5°C steps.
Physical law — warmer air holds more moisture
yes
yes
Check
Reference
Expected
Got
PASS
October — no condensation
gc=0 in the standard — no condensation expected.
EN ISO 13788:2012 table C.3, gc=0
yes
yes
PASS
November — condensation
gc=0.00006 kg/m² in the standard — condensation expected.
EN ISO 13788:2012 table C.3, gc=0.00006
yes
yes
PASS
December — condensation
gc=0.00013 kg/m² in the standard — condensation expected.
EN ISO 13788:2012 table C.3, gc=0.00013
yes
yes
PASS
January — condensation
gc=0.00015 kg/m² in the standard — condensation expected.
EN ISO 13788:2012 table C.3, gc=0.00015
yes
yes
PASS
February — condensation
gc=0.00013 kg/m² in the standard — condensation expected.
EN ISO 13788:2012 table C.3, gc=0.00013
yes
yes
PASS
March — condensation
gc=0.00008 kg/m² in the standard — condensation expected.
EN ISO 13788:2012 table C.3, gc=0.00008
yes
yes
PASS
August — no condensation
gc=0 in the standard — no condensation expected.
EN ISO 13788:2012 table C.3, gc=0
yes
yes
PASS
September — no condensation
gc=0 in the standard — no condensation expected.
EN ISO 13788:2012 table C.3, gc=0
yes
yes
PASS
Condensation at weatherproofing|insulation interface only
The standard identifies exactly one condensation interface in this construction.
EN ISO 13788:2012 Annex C.2 — single condensation plane
yes
yes
Check
Reference
Expected
Got
PASS
November condensation rate
EN ISO 13788:2012 table C.3
0 kg/m²
0 kg/m²
PASS
December condensation rate
EN ISO 13788:2012 table C.3
0.00013 kg/m²
0.00013 kg/m²
PASS
January condensation rate
EN ISO 13788:2012 table C.3
0.00015 kg/m²
0.00016 kg/m²
PASS
January accumulation
EN ISO 13788:2012 table C.3
0.00034 kg/m²
0.00036 kg/m²
PASS
March peak accumulation
EN ISO 13788:2012 table C.3
0.00055 kg/m²
0.00057 kg/m²
PASS
April drying rate
Negative = evaporation — assembly is drying.
EN ISO 13788:2012 table C.3
-0 kg/m²
-0 kg/m²
PASS
July — fully dried
Moisture must reach zero — assembly passes annual cycle.
EN ISO 13788:2012 table C.3
0.0 kg/m²
0.0 kg/m²
PASS
Annual pass — assembly dries out
EN ISO 13788:2012 section 6.5
yes
yes
Check
Reference
Expected
Got
PASS
July — condensation (warm humid summer)
gc=0.0941 kg/m² — condensation from warm moist external air.
EN ISO 13788:2012 table C.3, gc=0.0941 kg/m²
yes
yes
PASS
August — condensation
gc=0.1158 kg/m² — peak condensation month.
EN ISO 13788:2012 table C.3, gc=0.1158 kg/m²
yes
yes
PASS
September — condensation
gc=0.0211 kg/m² — condensation decreasing.
EN ISO 13788:2012 table C.3, gc=0.0211 kg/m²
yes
yes
PASS
January — no condensation (cool dry winter)
No condensation in winter — vapour drive reverses.
EN ISO 13788:2012 table C.3, gc=0
yes
yes
PASS
December — no condensation
No condensation in winter.
EN ISO 13788:2012 table C.3, gc=0
yes
yes
PASS
July annual cycle — condensation rate
EN ISO 13788:2012 table C.3
0.0941 kg/m²
0.0981 kg/m²
PASS
August annual cycle — accumulation
EN ISO 13788:2012 table C.3
0.2099 kg/m²
0.2133 kg/m²
PASS
November — fully dried
Assembly dries out by November.
EN ISO 13788:2012 table C.3
0.0 kg/m²
0.0 kg/m²
PASS
Annual pass — assembly dries out
EN ISO 13788:2012 section 6.5
yes
yes
Check
Reference
Expected
Got
PASS
October — no condensation
No condensation before winter.
EN ISO 13788:2012 table C.12, gc=0
yes
yes
PASS
November — no condensation
No condensation before winter.
EN ISO 13788:2012 table C.12, gc=0
yes
yes
PASS
December — no condensation
No condensation yet despite cold external temperature.
EN ISO 13788:2012 table C.12, gc=0
yes
yes
PASS
January — condensation
Condensation first appears in January in this climate.
EN ISO 13788:2012 table C.12, gc=0.0498
yes
yes
PASS
February — condensation
Condensation continues in February.
EN ISO 13788:2012 table C.12, gc=0.0113
yes
yes
PASS
April — fully dried
Assembly dries out completely by April.
EN ISO 13788:2012 table C.12, Ma=0
yes
yes
PASS
Annual pass — assembly dries out
Assembly passes the annual cycle — moisture does not accumulate year on year.
EN ISO 13788:2012 section 6.5
yes
yes
Check
Reference
Expected
Got
PASS
Surface resistance Rsi — horizontal heat flow
Walls use horizontal heat flow. ISO 6946:2017 Table 1 specifies Rsi=0.13 m²K/W.
ISO 6946:2017 Table 1
0.13 m²K/W
0.13 m²K/W
PASS
Surface resistance Rse — horizontal heat flow
ISO 6946:2017 Table 1
0.04 m²K/W
0.04 m²K/W
PASS
Single layer R-value — 100mm mineral wool λ=0.040
R = thickness/λ = 0.100/0.040 = 2.500 m²K/W — first principles
2.5 m²K/W
2.5 m²K/W
PASS
Single layer U-value — 100mm mineral wool λ=0.040
U = 1/(0.13 + 2.500 + 0.04) = 1/2.670 = 0.375 W/(m²·K) — first principles
0.375 W/(m²·K)
0.375 W/(m²·K)
PASS
Cavity wall U-value — plasterboard + aircrete + mineral wool + brick
Typical UK partial-fill cavity wall. Each layer R = thickness/λ, summed with surface resistances.
U = 1/(0.13 + 0.050 + 0.909 + 2.143 + 0.132 + 0.04) = first principles
0.294 W/(m²·K)
0.294 W/(m²·K)
PASS
Total thickness — cavity wall
Sum of layer thicknesses: 12.5 + 100 + 75 + 102 = 289.5mm
289.5 mm
289.5 mm
Check
Reference
Expected
Got
PASS
Surface resistance Rsi — upward heat flow
Roofs use Rsi=0.10, not 0.13 (wall) or 0.17 (floor). Using the wrong value is a common error.
ISO 6946:2017 Table 1
0.1 m²K/W
0.1 m²K/W
PASS
U-value — 120mm PIR insulation λ=0.022
U = 1/(0.10 + 0.120/0.022 + 0.04) = 1/(0.10 + 5.455 + 0.04) — first principles
0.179 W/(m²·K)
0.179 W/(m²·K)
PASS
Roof U-value higher than wall with same insulation
Roof Rsi=0.10 < wall Rsi=0.13 → lower total R → higher U-value for identical construction.
ISO 6946:2017 Table 1 — lower Rsi for upward heat flow
yes
yes
Check
Reference
Expected
Got
PASS
Surface resistance Rsi — downward heat flow
Rsi=0.17 is the highest surface resistance — downward heat flow has the least convective assistance.
ISO 6946:2017 Table 1
0.17 m²K/W
0.17 m²K/W
PASS
U-value — 150mm mineral wool λ=0.035
U = 1/(0.17 + 0.150/0.035 + 0.04) = 1/(0.17 + 4.286 + 0.04) — first principles
0.222 W/(m²·K)
0.222 W/(m²·K)
PASS
Floor U-value lower than wall with same insulation
Floor Rsi=0.17 > wall Rsi=0.13 → higher total R → lower U-value for identical construction.
ISO 6946:2017 Table 1 — higher Rsi for downward heat flow
yes
yes
Check
Reference
Expected
Got
PASS
Characteristic dimension B' — 8×6m floor (A=48m², P=28m)
B' represents the effective width of the floor for heat loss calculations.
B' = A/(0.5×P) = 48/14 = 3.429m — ISO 13370:2017 equation 2
3.429 m
3.429 m
PASS
Equivalent thickness dt — screed+PIR+concrete, w=0.3m, λg=2.0
dt converts the floor construction resistance into an equivalent ground thickness.
dt = w + λg×(Rsi+Rf+Rse) — ISO 13370:2017 equation 4
10.278 m
10.278 m
PASS
U-value — deep slab case (dt ≥ B') — 8×6m floor with PIR
Deep slab equation applies when insulation is thick relative to floor size.
U = λg/(0.457×B' + dt) — ISO 13370:2017 equation 6
0.169 W/(m²·K)
0.169 W/(m²·K)
PASS
U-value — shallow slab case (dt < B') — large floor, thin insulation
Shallow slab equation applies for large floors or lightly insulated constructions.
U = (2λg/(π×B'+dt)) × ln(π×B'/dt + 1) — ISO 13370:2017 equation 5
0.379 W/(m²·K)
0.379 W/(m²·K)
PASS
Larger floor gives lower U-value
Larger floors have proportionally less perimeter heat loss — the ground insulates the centre.
ISO 13370:2017 — larger B' reduces edge heat loss proportionally
yes
yes
Check
Reference
Expected
Got
PASS
Equivalent thickness of ground below the void, dg
dg = w + λg×(Rsi+Rf,ins+Rse) — ISO 13370 equation 9 (spreadsheet cell C23)
0.795 m
0.795 m
PASS
Ground heat-loss coefficient, Ug
Ug — ISO 13370 equation 10, using BR497 §4.7.2's own fixed P/A=0.5 (spreadsheet cell C22)
0.6338 W/(m²·K)
0.6336 W/(m²·K)
PASS
Floor deck U-value, Uf,sus
A real, pre-existing bug (Rsi+Rf+Rse) was found and fixed via this exact cross-check.
Uf,sus = 1/(Rsi+Rf+Rsi) — BOTH surfaces at the downward-heat-flow convention, per BR 443's own text (spreadsheet cell C33)
0.3052 W/(m²·K)
0.3051 W/(m²·K)
PASS
Void ventilation rate, V'
V' = 0.59×ε×v×fw — ISO 13370 Annex G equation G.4 (spreadsheet cell C16)
0.00022125 m³/(s·m)
0.00022100 m³/(s·m)
PASS
Underfloor space temperature, Tu
Matches the spreadsheet's own worked example to within its own Rsi=5.9-vs-0.17 rounding.
Tu — ISO 13370 Annex G equation G.1 (spreadsheet cell C29)
5.675 °C
5.675 °C
PASS
Tu lies strictly between Te and Ti
A physically-required consequence of equation G.1's own weighted-average form
yes
yes
Check
Reference
Expected
Got
PASS
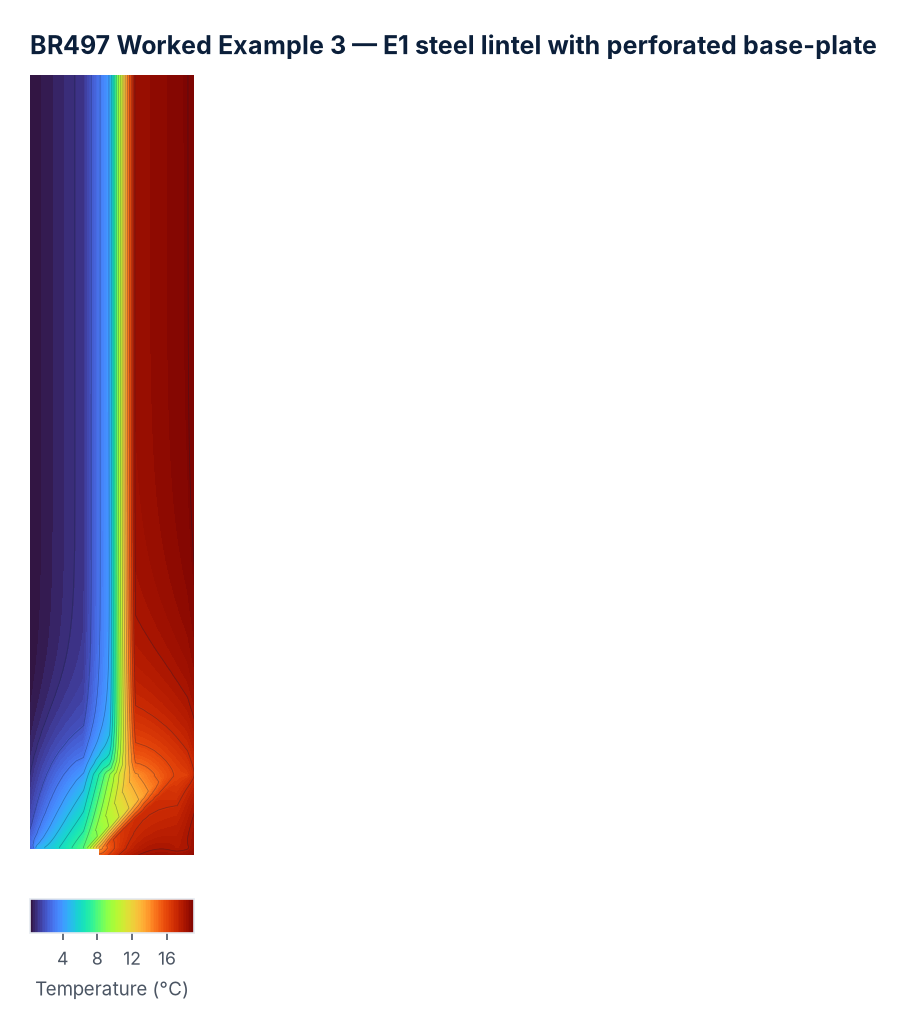
Perforated base-plate equivalent conductivity
Ten column pitches of the staggered slot pattern, isothermal faces.
BR 497 Appendix B, Worked Example 3, Step 5 (§2.3.1)
6.9 W/m·K
6.9 W/m·K
PASS
Base-plate effective conductivity is reliable
Surface films are 6.5% of total resistance.
uvalue_from_fem.EFFECTIVE_LAMBDA_SURFACE_SHARE_LIMIT
yes
yes
PASS
Air space 1 transformed thickness d
cavity, downward heat flow.
BR 497 Appendix B, Table B3b (§2.4.3)
70 mm
70 mm
PASS
Air space 1 thermal resistance
Resolved by air_cavity 3.1.0.
BR 497 Appendix B, Table B3b
0.218 m²K/W
0.219 m²K/W
PASS
Air space 1 equivalent conductivity
Surfaces 0.9/0.9.
BR 497 Appendix B, Table B3b
0.322 W/m·K
0.320 W/m·K
PASS
Air space 2 transformed thickness d
divided, horizontal heat flow.
BR 497 Appendix B, Table B3b (§2.4.3)
66 mm
66 mm
PASS
Air space 2 thermal resistance
Resolved by air_cavity 3.1.0.
BR 497 Appendix B, Table B3b
0.231 m²K/W
0.233 m²K/W
PASS
Air space 2 equivalent conductivity
Surfaces 0.9/0.9.
BR 497 Appendix B, Table B3b
0.286 W/m·K
0.285 W/m·K
PASS
Air space 3 transformed thickness d
divided, horizontal heat flow.
BR 497 Appendix B, Table B3b (§2.4.3)
97 mm
96 mm
PASS
Air space 3 thermal resistance
Resolved by air_cavity 3.1.0.
BR 497 Appendix B, Table B3b
0.231 m²K/W
0.233 m²K/W
PASS
Air space 3 equivalent conductivity
Surfaces 0.9/0.9.
BR 497 Appendix B, Table B3b
0.42 W/m·K
0.41 W/m·K
PASS
Flanking elements detected
lw = 1.5m, per the worked example's own figure.
BR 497 §3.1 — one flank, the wall above the opening
1
1
PASS
Flanking wall U-value
Derived from the drawn build-up, not taken from the published figure.
BR 497 Appendix B, Worked Example 3, Step 8 (U'w)
0.33 W/m²K
0.33 W/m²K
PASS
Linear thermal transmittance psi
Published as 0.416 before rounding to the declared 0.42.
BR 497 Appendix B, Worked Example 3, Step 9 (declared value)
0.42 W/m·K
0.41 W/m·K
PASS
Temperature factor fRsi
Surface resistances per Table B3a, applied by element type (§3.2).
BR 497 Appendix B, Worked Example 3, Step 9 (declared value)
0.75
0.76
Computed temperature field (colour) with isotherm contours (black lines)
Checks run live on the production worker using the same modules that compute your calculations. Reference values are taken directly from published standards and verified independently.